Excel vs AI Tool: A Practical Side-by-Side Comparison
A rigorous, developer-friendly comparison of Excel versus AI tools, exploring use cases, data workflows, performance, costs, and integration for researchers, developers, and students.

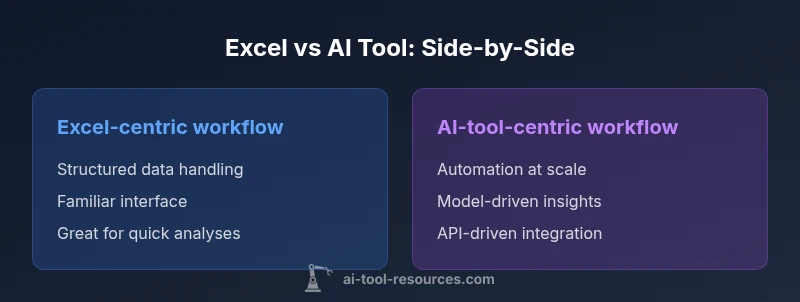
Excel provides a fast, familiar workspace for structured tabular tasks and routine analysis. AI tools excel at automation, large-scale data processing, and model-driven insights. For most teams, the best approach blends both: use Excel for structured data collection and lightweight calculations, while layering AI-powered tools for automation, enrichment, and scalable analytics.
What does Excel vs AI Tool mean in modern data work?
In 2026, many teams rely on a mix of spreadsheet-based workflows and AI-powered automation. The phrase excel vs ai tool captures a spectrum: Excel is a familiar, grid-based environment optimized for tabular data, while AI tools offer programmability, model-driven insights, and scalable automation. According to AI Tool Resources, the most effective organizations don’t pick one over the other; they orchestrate both to meet different stages of data work. This article analyzes the tradeoffs, enumerates decision criteria, and provides practical guidance for developers, researchers, and students exploring AI tools. The goal is to help you map your use cases to the best-fitting tool, or to a thoughtful hybrid pipeline that leverages their respective strengths.
Core capabilities: Excel vs AI tools
Excel is a powerful data workbench built around a grid of cells, formulas, pivot tables, and an ever-expanding set of add-ins. Its core strengths include deterministic calculations, transparent data visualization, and a low-friction learning curve for many office workers. AI tools, by contrast, are defined by access to models, pipelines, and automation capabilities that scale beyond a single workbook. They excel at tasks like data enrichment, anomaly detection, forecasting, and natural language processing. For developers and researchers, this means you can prototype ideas quickly in notebooks or cloud environments and connect those ideas back to your spreadsheets for reporting. The real value comes when you recognize that Excel’s reliability and human-centric workflows can be paired with AI’s predictive power and automation to create end-to-end data solutions. The interplay between Excel and AI tools often defines modern data maturity.
Data scale and performance considerations
Data scale is a critical differentiator between the two approaches. Excel handles datasets well up to a point, but performance degrades as workbook size, formulas, and complex charts accumulate. Modern Excel with Power Query and data model features can handle larger datasets, but memory and CPU constraints remain a practical limit for analysts working on commodity hardware. AI tools designed for cloud or high-powered local compute can manage terabytes of data and perform model inference in parallel, enabling batch processing, streaming analytics, and feature engineering at scale. When deciding, map your data profile: steady, tabular datasets under a few hundred thousand rows may be comfortable in Excel with optimized queries; larger, multi-source datasets with real-time needs typically benefit from AI-assisted pipelines and data platforms. Don’t underestimate governance: data versioning and lineage become more critical as scale increases.
Automation and workflow patterns
Automation is where Excel and AI tools truly diverge and then converge. In Excel, automation arises from formulas, macros, and Power Automate flows that trigger actions inside or outside spreadsheets. This path emphasizes human intuition and auditability, with predictable, rule-based outcomes. AI tools offer event-driven automation through APIs, orchestration platforms, and model inference pipelines. They enable tasks like automatic data extraction, quality checks, anomaly alerts, and decision support at scale. The best practice is to design flows that start in Excel for data collection and validation, then pass data to an AI service for enrichment, then loop results back into Excel for visualization and decision-making. By documenting inputs, outputs, and decision thresholds, you create transparent, auditable pipelines that combine the strengths of both worlds.
Cost, licensing, and total cost of ownership
Cost considerations influence every decision. Excel’s baseline cost is tied to office suite subscriptions, which many organizations already pay for, making the incremental cost of basic usage relatively low. AI tools introduce variable expenses: cloud inference, API calls, model training, and data storage can accumulate quickly, especially at scale. For teams of researchers or developers experimenting with prototypes, the cost delta may be modest if you use pay-as-you-go services and community editions. For enterprise-grade deployments, licensing, data egress, security features, and governance tooling add to the total cost of ownership. When evaluating, create a simple TCO model across your typical workloads: data size, frequency, API calls, and the expected lifetime of the project. The aim is to compare apples to apples: what is the true cost for your expected use over 12, 24, or 36 months.
Integration and ecosystem fit
Excel sits in the heart of the Microsoft ecosystem, with seamless integration to Power Query, Power BI, and a broad set of add-ins. That integration accelerates data cleaning, visualization, and reporting within familiar interfaces. AI tools, on the other hand, often shine when connected to data lakes, notebooks, and cloud platforms. They can orchestrate pipelines across disparate systems, run large-scale experiments, and deploy models as services. The sweet spot arises when you design data products that start in Excel for data capture and QA, flow through AI services for enrichment and inference, and return to Excel or BI dashboards for final consumption. An effective strategy uses common data formats (CSV, Parquet) and consistent metadata so both sides understand the inputs and outputs. You’ll also want to plan for authentication, access control, and data governance across tools to avoid silos.
Security, governance, and compliance
Security and governance become more nuanced when data crosses tool boundaries. Excel workbooks stored locally or in shared drives can minimize external exposure, but cloud-based AI services introduce new vectors for data in transit and model exposure. Establish clear data classification, access controls, and retention policies. Use versioned datasets, audit logs, and standardized templates so inputs and outputs stay traceable. For researchers and students, this means splitting sensitive data from experiment data, using synthetic or anonymized datasets for prototyping, and documenting consent and licensing for any data used. When possible, adopt a centralized governance framework that covers both Excel workbooks and AI pipelines to reduce risk and improve reproducibility.
Use cases by persona: developers, researchers, students
Developers often optimize data pipelines by stitching Excel inputs to AI models via APIs, creating reusable components in notebooks, and deploying lightweight dashboards. Researchers rely on AI to accelerate experiments, feature extraction, and predictive modeling, while using Excel for data curation and reporting. Students benefit from a gentle entry point in Excel for foundational statistics, then graduate to AI tools as they encounter more complex projects. A practical approach is to build a layered workflow: collect clean data in Excel, use AI tooling for processing at scale, and present the results back in Excel or a BI tool for peer review and learning.
Comparison
| Feature | Excel-centric workflow | AI-tool-centric workflow |
|---|---|---|
| Automation capabilities | Excel-centric automation via formulas/macros/vba | AI-tool automation via APIs/workflows |
| Data scale and performance | Best for smaller datasets within workbook limits | Handles large-scale data processing and model inference |
| Learning curve | Familiar for Excel users; VBA/Power Query add-ons may require learning | Requires familiarity with AI tooling and scripting |
| Integration options | Ties to Microsoft ecosystem (Power Query, Power Automate, Power BI) | Connects to data lakes, notebooks, and external APIs |
| Cost/ownership | Included with office subscriptions; add-ins can add costs | Usage-based or subscription pricing for cloud AI tools |
| Best for | Financial models, quick analyses, and auditability | Automation, ML prototyping, scalable analytics |
Upsides
- Low learning curve for basic tasks
- Strong grid-based data handling and visualization
- Tightly integrated with existing office workflows and templates
- Cost-effective for small teams and individuals
- Extensive community support and resources
Weaknesses
- Limited scalability for very large datasets without external tools
- Advanced AI features may require cloud services and governance
- Potential for data governance issues with cloud-based workflows
- Maintenance complexity increases with larger, multi-step spreadsheets
Hybrid approach is best: use Excel for structured, routine work and AI tools for automation and scalable analytics.
Excel remains a solid baseline for tabular tasks and quick analyses. AI tools excel at automation and modeling at scale. A hybrid workflow, where Excel handles data capture and presentation and AI handles enrichment and inference, generally yields the strongest outcomes.
FAQ
What is the main distinction between Excel and AI tools for data analysis?
Excel offers structured tabular analysis with formulas, pivot tables, and macros. AI tools provide automation, prediction, and model-driven insights via APIs and services.
Excel is great for tables and quick analyses; AI tools bring automation and models. It’s a matter of scope and scale.
Can Excel incorporate AI features directly?
Yes, Excel supports AI-assisted features through add-ins and built-in capabilities like Ideas, plus broader Microsoft 365 integrations with cloud AI services.
Yes—Excel can tap into AI through Ideas and add-ins.
Which tool is better for beginners?
Excel is generally easier to start with due to familiarity and a gentler learning curve. AI tools require some scripting and API familiarity.
If you’re new, start with Excel; AI tools take more time to learn.
How do I combine Excel with AI workflows in practice?
Use Excel to collect and preprocess data, then send it to an AI service for processing; return results to Excel for visualization and decision-making.
Create data pipelines from Excel to AI tools and back.
What about cost and licensing?
Excel’s costs are bundled with office subscriptions; AI tools often use usage-based or monthly pricing. Your total cost depends on scale and duration.
Costs vary—Excel is often bundled, AI tools can be subscription-based.
What are best practices for governance when mixing Excel and AI?
Implement data dictionaries, versioning, access controls, and clear data lineage. Document model inputs/outputs and ensure compliance across tools.
Governance matters when mixing Excel and AI.
Key Takeaways
- Define your data size and complexity before choosing tools
- Use Excel for reliability and speed on small to medium datasets
- Leverage AI tools for automation and large-scale analytics
- Invest in governance and security when using cloud AI
- Bridge Excel and AI workflows with integrated pipelines